Summary
Oil is slipping back towards $59 as the Iran scare cools and attention returns to supply and inventory data.
Gold is holding near $4,600 after setting fresh records, but short-term signals point to a possible pause or pullback.

Macro – why these markets might move today
Oil has gone from drama to drift in the space of a few days. Earlier this week both Brent and WTI pushed to multi-week highs as protests in Iran and talk of a possible US strike had traders pricing in a supply shock. Now the tone has changed. Comments out of Washington have played down the chances of immediate military action, Tehran’s response has eased a little, and the market is quietly taking the “war premium” back out of the price.
At the same time, the fundamental backdrop looks comfortable rather than tight. Recent US data show crude and gasoline stocks rising instead of drawing down, while Venezuela has started to rebuild exports. That combination of softer geopolitics and steady supply helps explain why WTI has dropped back below $60 and is now hovering around $59, with traders talking again about a broad $57–$67 range rather than a new bull trend.
Gold is coming from the opposite place. It has started 2026 with a bang, pushing through $4,600 to fresh all-time highs as central-bank buying, geopolitical worries and hopes for future rate cuts have all supported demand. This week’s price action, though, hints at tiredness. Gold is still near the highs, but candles on the 4-hour chart show a bearish engulfing pattern, and momentum indicators are rolling over. It looks more like a market taking a breather than one in full retreat.
The key driver for both today is the data. Germany’s latest CPI numbers hit early in the session, keeping the European inflation story in play. Later in the day, traders will be watching US industrial production and labour figures. Strong data would tend to support the dollar and push up real yields, which usually leans against gold but can be supportive for oil demand. Softer numbers would do the opposite, helping gold but potentially reviving worries about future fuel use.
Levels – Gold & Oil context for London traders
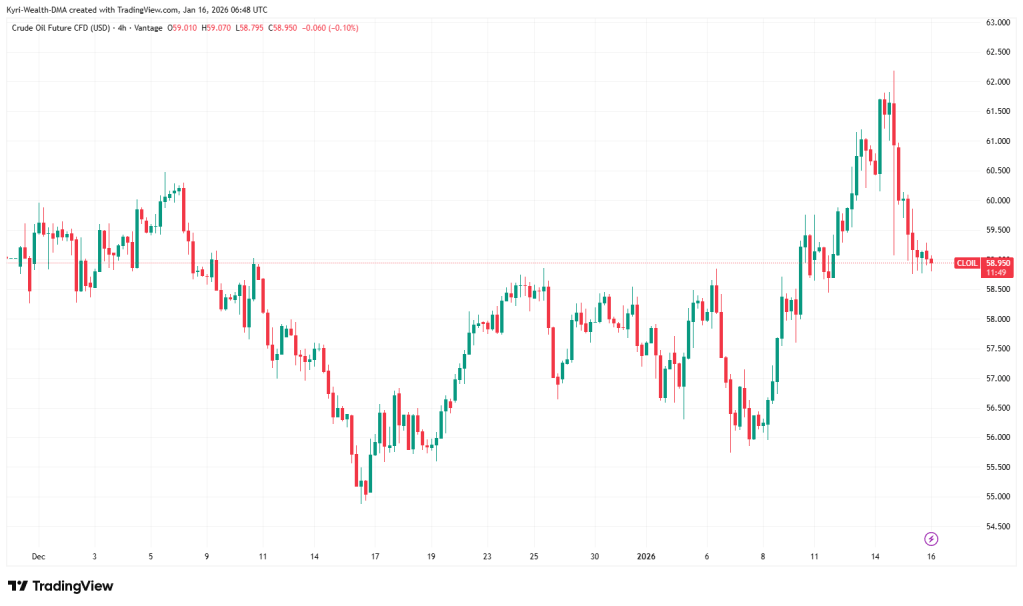
WTI crude (front month)
Spot on the chart is around $58.95–$59.00.
- Support: $58.50, then $57.70, then around $56.00
- Resistance: $60.00, then roughly $61.50–$62.00
Your 4-hour chart shows WTI spiking through $61–$62 on the Iran panic and then dropping straight back into the old range. That makes the $58.50–$59.00 band important:
- If WTI holds above $58.50 into the US data window, the story is simple: the market has priced out the worst of the Iran fear, but buyers are still prepared to defend the range. Intraday, that frames $58.50 as the lower edge of a box, with $60.00–$60.50 as the top.
- If WTI breaks and spends time below $58.50, traders will say the war premium is fully unwound. The tone shifts back to “rangebound and heavy”, and the conversation moves towards $57.70 and even the $56 area seen earlier in the winter.
For someone trading around a day job, those two scenarios are enough: above $58.50 you are dealing with a choppy range; below it you are dealing with a market that could slide back towards the lows if the data disappoints.
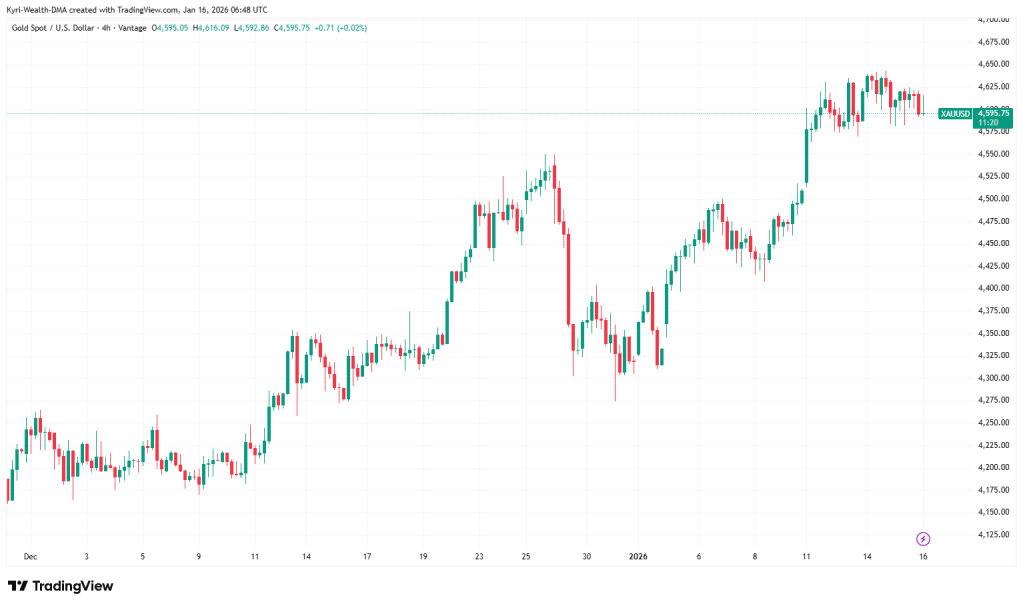
Gold (XAUUSD)
Spot on the chart is around $4,595–$4,600.
- Support: about $4,576, then $4,510
- Resistance: about $4,646, then $4,700
Gold’s 4-hour chart shows price moving sideways just under this week’s record highs. A recent bearish engulfing candle and softening momentum hint that the easy part of the move may be over for now.
- If gold holds above roughly $4,575, dips can still be treated as part of an orderly pause within an uptrend. That keeps the door open for another push towards the $4,645–$4,700 area if US data comes in soft or fresh geopolitical worries flare up.
- If gold breaks and holds below $4,575, especially if it heads towards $4,510, the tone changes. The market may start a deeper clean-out of late buyers before it even thinks about another record high. For short-term traders, that is the difference between “buy every dip” and “wait for a better level”.
The main point: both gold and oil are near levels where a busy London and US session can flip the story very quickly.
Human Truth
Most traders are still reacting to yesterday’s headline, even when today’s move is about something completely different.
Calendar – what matters today
Today’s session is built around a handful of simple time slots.
In the morning, Germany’s CPI print keeps the European inflation story alive and sets the tone for risk sentiment in the region.
Later, the focus shifts to the US, with industrial production and labour-market data on the docket. These numbers sit on top of this week’s inflation releases and will shape how many rate cuts the market still expects from the Fed.
That path for rates drives the dollar and real yields, which feed straight into gold. At the same time, strong or weak growth signals from the US change how comfortable traders feel holding exposure to oil at the end of a week that started with war headlines.
Wrap – how a busy trader might use this
If you are fitting trading around a full working day, the aim is not to catch every wiggle. The aim is to know which levels matter and when the big information hits.
In oil, the $58.50 line on WTI tells you whether we are simply deflating a risk premium or shifting back into a heavier, surplus-driven market. In gold, the $4,575–$4,510 area separates a pause near record highs from a more meaningful clear-out.
You do not need a complicated view. You just need to decide in advance what your plan is if price reaches those levels, and how much size you are comfortable risking on that plan. The data will move the market. Your edge is having a simple, written idea of what to do when it does.
What one change to your position size or trade frequency would clean up your trading this week?
Test your strategy with Vantage
Try your ideas on a demo first
Before risking real money, put today’s plan into a simple routine:
- Mark your key levels on oil and gold.
- Decide your entry, your stop, and your target.
- Run it on a demo account for a few days and see how it behaves.
Open a free Vantage demo account here to test your strategy with live prices but no real risk:
Demo account: https://www.vantagemarkets.com/open-demo-account/?affid=NTg0MzU=
Once you are set up, you can trade from your phone while you are on the move:
Download the Vantage app:
https://h5.vantagemarketapp.com/h5/thirdparty/support/register?agentAccount=NTg0MzU=
Use the demo like a practice shift: same markets, same levels, but no fare on the line. When you can follow your plan consistently on demo, then you decide how much real risk makes sense for you.


Leave a comment