The Print That Can Move the Entire S&P 500**
If you want to know where this market goes next — not just tech, not just semis, but the whole index — you’re looking at one chart tonight: Nvidia.
Everything else is noise. Bonds, gold, the dollar — all ticking, all relevant, but secondary. Because when a single name carries nearly 8% of the S&P 500, the company’s earnings aren’t a datapoint. They’re market direction.
Looking at Nvidia’s chart this morning, you see a stock that has already rolled over from the October highs around $210 and is now sitting near $181 — basically the same zone it defended during August–September. It’s not a collapse, not a trend break, but a clear loss of momentum. Lower highs, buyers hesitating, sellers probing.
Compare that with the S&P 500 chart right beneath it: a beautiful 6-month grind higher from the April lows, topping near 6,900, and now giving back steam ahead of tonight’s catalyst.
The uptrend is intact, but we’re watching the steepest part of the curve lose air. You don’t need a macro model to understand correlation risk. You just need to look at both charts side by side.
Nvidia is the fulcrum.
So let’s talk about what tonight actually means — for NVDA holders, traders, option players, and anyone exposed to the S&P 500 whether you like it or not.
1. Nvidia’s Chart Tells You the Market Is Nervous — Not Broken
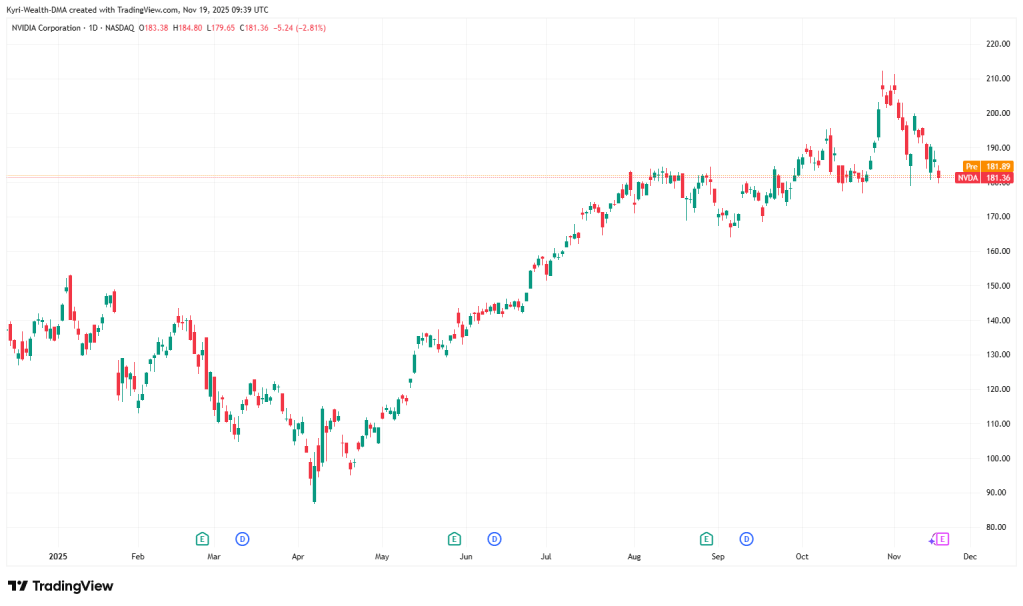
- NVDA peaked near $210 in late October.
- Pulled back almost 14% into the $181 area.
- Now sitting on mid-range support that held multiple times in September/October.
That range is crucial. Lose it, and $170 comes into view. Hold it, and any upside surprise after earnings could shove this thing right back into the $195–$200 zone before month-end.
The market is pricing a big move — implied 7%. But the chart is telling you something more subtle:
Buyers haven’t bailed. Sellers haven’t taken control.
Both sides are waiting for the number.
This is classic “price compression before catalyst.”
2. The S&P 500 Is Sitting in a Perfectly Vulnerable Spot
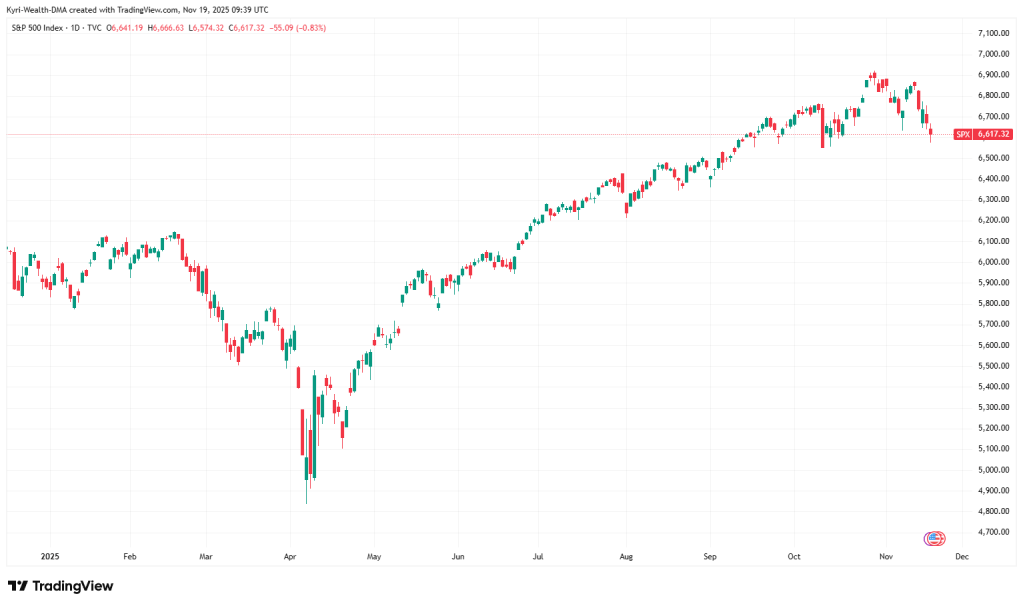
- The index topped near 6,900, failed twice, and rolled into 6,620.
- That’s a textbook short-term downshift.
- But the trendline from April is still intact — barely.
If Nvidia beats big?
SPX reclaims 6,700 fast. Tech drags everything higher. Energy and cyclicals follow. Volatility collapses.
If Nvidia disappoints?
You can kiss that trendline goodbye.
We probably test 6,500 — maybe even 6,420 if guidance is soft.
A single earnings print triggering 200–250 points in the S&P sounds dramatic — until you remember Nvidia alone can swing $320 billion in market cap overnight.
The index is pricing tight. There’s no cushion.
3. The Real Question Tonight: Has AI Demand Peaked Short-Term?
Forget earnings-per-share beats. Nvidia nearly always prints a top-line and EPS beat. The market doesn’t care.
The real question is:
Is AI demand accelerating or flattening?
If Nvidia shows:
- Blowout data-center revenue
- Gross-margin expansion
- Continued lead times on H200 and Blackwell systems
- Strong hyperscaler appetite
→ The whole AI complex rips.
→ Semis rip.
→ S&P rips.
→ Momentum funds re-risk.
→ VIX gets crushed.
But if we see:
- Slower forward guidance
- Margin compression from supply-chain absorption
- Signs hyperscaler capex is pausing
- Inventory normalisation
- Slowing orders from big cloud names
→ Tech unwinds.
→ Semis get hit first.
→ The S&P follows like a docile dog on a lead.
This is why traders care so much. Nvidia isn’t reporting earnings — it’s reporting the state of the AI economy.

4. Investor Playbook: If You’re a Long-Term Holder
You’ve seen this movie.
The stock dipped from $210 to $140 earlier this year.
Then ripped to $210.
Now it dipped back to $181.
If you believe AI infrastructure is a multi-year buildout — like cloud was from 2010–15 — then tonight’s print is noise.
The only reason to trim before earnings is sizing.
If Nvidia is 15–20% of your book, reduce.
If it’s 5–7%, chill.
Long-term investors don’t need to do anything emotional tonight.

5. CFD Trader Playbook: Volatility Without a Plan Is Suicide
CFD traders get seduced by nights like this.
But after-hours spreads widen like a crocodile’s jaw. If you’re not used to trading these conditions, you’re stepping into a hurricane with no jacket.
Your options:
A) Don’t trade the print — trade the reaction.
Let the first 5–15 minutes settle.
Then play structure: support breaks, VWAP reclaims, failed rallies.
B) Tiny position sizing.
CFDs + earnings volatility + full size = margin call.
C) If in doubt, demo trade it.
Seriously — most pros don’t touch earnings directionally unless they have flow data.
6. Options Trader Playbook: Implied Volatility Is Your Enemy Tonight
The IV is huge.
Buying calls or puts into this print is like buying a Ferrari at double the price.
Your realistic plays:
A) Calendar spreads
Sell short-term IV, buy longer-dated where vol is normal.
B) Iron condors / credit spreads
Defined risk. You know your max loss.
C) Post-earnings gamma scalping
Advanced, not for beginners.
D) Do nothing
Traders forget this is a valid move.
Most retail option traders lose money on nights exactly like this because they underestimate IV crush.
7. How Nvidia’s Print Hits the S&P 500 — Scenario Map
Scenario A — Monster Beat
NVDA +10–14%
S&P 500 +1.5–2.2%
VIX collapses 15–20%
Tech leads. Semis melt up. Shorts get disintegrated.
Scenario B — Beat but Soft Guidance
NVDA –3% to –7%
S&P 500 –0.5% to –1.2%
Market interprets this as “AI digestion phase.”
Scenario C — Miss
NVDA –10–15%
S&P 500 –2%+
This is the “risk-off” trigger.
Hedge funds derisk. Correlations go to 1.
Scenario D — Inline + Neutral Tone
NVDA –2% to +2%
S&P flat to –0.4%
IV collapses; options traders suffer.
This is the most boring and least likely scenario.
Kyri’s Final Take
Nvidia isn’t just reporting earnings.
It’s reporting the temperature of the entire AI cycle — and the S&P 500 is standing right next to it with a thermometer.


Leave a comment